Premier League · 2025/26
Team Pages
Form, fixtures, shotmaps and simulated league positions for every Premier League club.
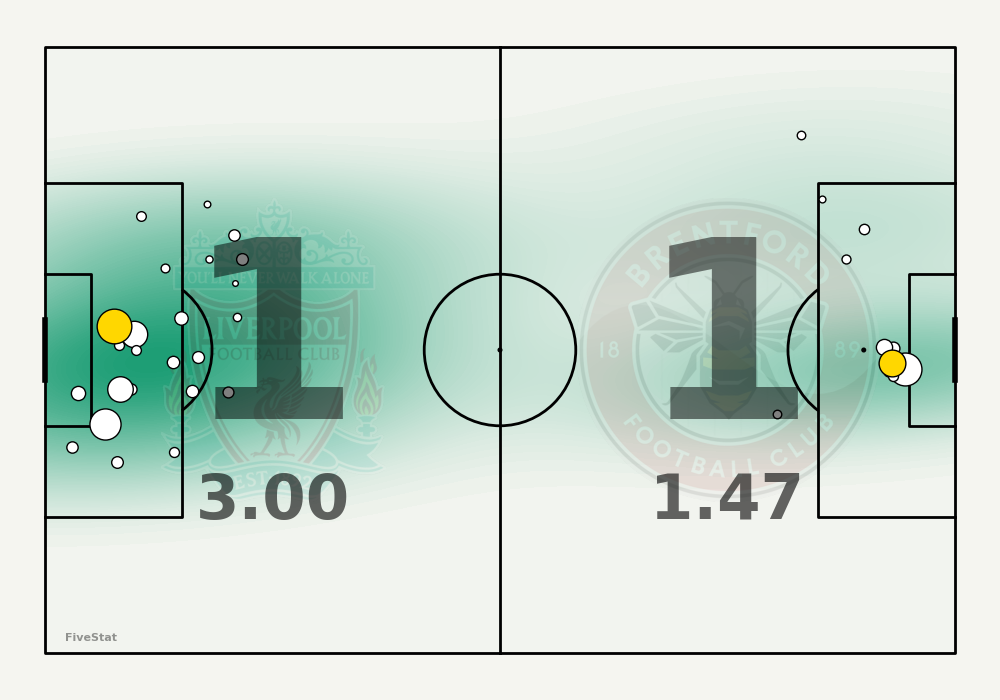
Brentford
9
Position
53
Points
14
Won
11
Drawn
13
Lost
55
GF
52
GA
66.5
xG
59.2
xGA
Fixtures
Previous
Upcoming

League Position
| Pos | Team | MP | W | D | L | G | GA | GD | PTS |
|---|---|---|---|---|---|---|---|---|---|
| 6 | Bournemouth | 38 | 13 | 18 | 7 | 58 | 54 | 4 | 57 |
| 7 | Sunderland | 38 | 14 | 12 | 12 | 42 | 48 | -6 | 54 |
| 8 | Brighton | 38 | 14 | 11 | 13 | 52 | 46 | 6 | 53 |
| 9 | Brentford | 38 | 14 | 11 | 13 | 55 | 52 | 3 | 53 |
| 10 | Chelsea | 38 | 14 | 10 | 14 | 58 | 52 | 6 | 52 |
| 11 | Fulham | 38 | 15 | 7 | 16 | 47 | 51 | -4 | 52 |
| 12 | Newcastle United | 38 | 14 | 7 | 17 | 53 | 55 | -2 | 49 |
Simulated Final League Position
| Pos | Team | 1 | 2 | 3 | 4 | 5 | 6 | 7 | 8 | 9 | 10 | 11 | 12 | 13 | 14 | 15 | 16 | 17 | 18 | 19 | 20 | Final xPTS |
|---|---|---|---|---|---|---|---|---|---|---|---|---|---|---|---|---|---|---|---|---|---|---|
| 6 | Bournemouth | 0.0% | 0.0% | 0.0% | 0.0% | 0.0% | 100.0% | 0.0% | 0.0% | 0.0% | 0.0% | 0.0% | 0.0% | 0.0% | 0.0% | 0.0% | 0.0% | 0.0% | 0.0% | 0.0% | 0.0% | 57.0 |
| 7 | Sunderland | 0.0% | 0.0% | 0.0% | 0.0% | 0.0% | 0.0% | 100.0% | 0.0% | 0.0% | 0.0% | 0.0% | 0.0% | 0.0% | 0.0% | 0.0% | 0.0% | 0.0% | 0.0% | 0.0% | 0.0% | 54.0 |
| 8 | Brighton | 0.0% | 0.0% | 0.0% | 0.0% | 0.0% | 0.0% | 0.0% | 100.0% | 0.0% | 0.0% | 0.0% | 0.0% | 0.0% | 0.0% | 0.0% | 0.0% | 0.0% | 0.0% | 0.0% | 0.0% | 53.0 |
| 9 | Brentford | 0.0% | 0.0% | 0.0% | 0.0% | 0.0% | 0.0% | 0.0% | 0.0% | 100.0% | 0.0% | 0.0% | 0.0% | 0.0% | 0.0% | 0.0% | 0.0% | 0.0% | 0.0% | 0.0% | 0.0% | 53.0 |
| 10 | Chelsea | 0.0% | 0.0% | 0.0% | 0.0% | 0.0% | 0.0% | 0.0% | 0.0% | 0.0% | 100.0% | 0.0% | 0.0% | 0.0% | 0.0% | 0.0% | 0.0% | 0.0% | 0.0% | 0.0% | 0.0% | 52.0 |
| 11 | Fulham | 0.0% | 0.0% | 0.0% | 0.0% | 0.0% | 0.0% | 0.0% | 0.0% | 0.0% | 0.0% | 100.0% | 0.0% | 0.0% | 0.0% | 0.0% | 0.0% | 0.0% | 0.0% | 0.0% | 0.0% | 52.0 |
| 12 | Newcastle United | 0.0% | 0.0% | 0.0% | 0.0% | 0.0% | 0.0% | 0.0% | 0.0% | 0.0% | 0.0% | 0.0% | 100.0% | 0.0% | 0.0% | 0.0% | 0.0% | 0.0% | 0.0% | 0.0% | 0.0% | 49.0 |
Position Probability Distribution
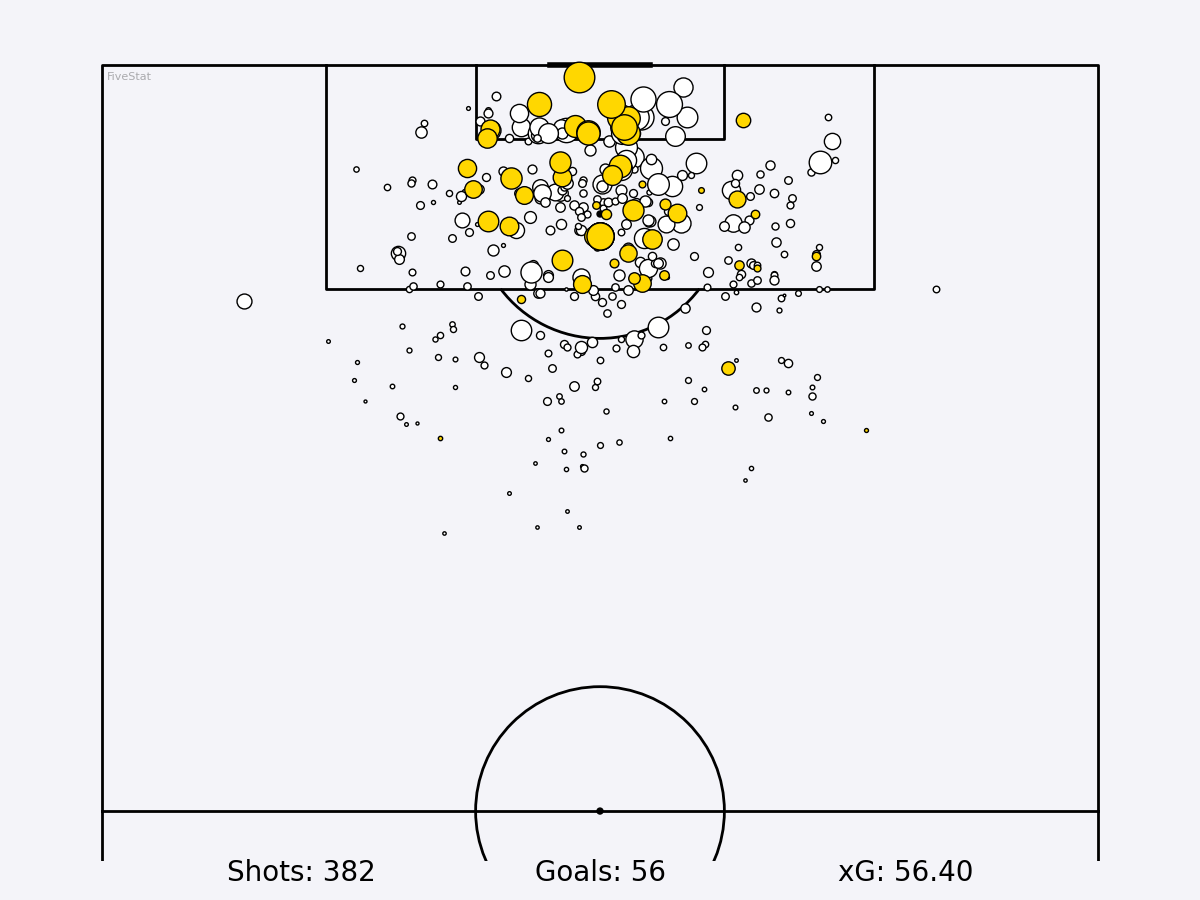
Team Shotmap
We'd love your feedback!
Please take a moment to answer a few quick questions to help improve FiveStat.