Premier League · 2025/26
Team Pages
Form, fixtures, shotmaps and simulated league positions for every Premier League club.
Tottenham Hotspur
17
Position
41
Points
10
Won
11
Drawn
17
Lost
48
GF
57
GA
47.0
xG
55.6
xGA
Fixtures
Previous

Upcoming

League Position
| Pos | Team | MP | W | D | L | G | GA | GD | PTS |
|---|---|---|---|---|---|---|---|---|---|
| 14 | Leeds | 38 | 11 | 14 | 13 | 49 | 56 | -7 | 47 |
| 15 | Crystal Palace | 38 | 11 | 12 | 15 | 41 | 51 | -10 | 45 |
| 16 | Nottingham Forest | 38 | 11 | 11 | 16 | 48 | 51 | -3 | 44 |
| 17 | Tottenham Hotspur | 38 | 10 | 11 | 17 | 48 | 57 | -9 | 41 |
| 18 | West Ham | 38 | 10 | 9 | 19 | 46 | 65 | -19 | 39 |
| 19 | Burnley | 38 | 4 | 10 | 24 | 38 | 75 | -37 | 22 |
| 20 | Wolverhampton Wanderers | 38 | 3 | 11 | 24 | 27 | 68 | -41 | 20 |
Simulated Final League Position
| Pos | Team | 1 | 2 | 3 | 4 | 5 | 6 | 7 | 8 | 9 | 10 | 11 | 12 | 13 | 14 | 15 | 16 | 17 | 18 | 19 | 20 | Final xPTS |
|---|---|---|---|---|---|---|---|---|---|---|---|---|---|---|---|---|---|---|---|---|---|---|
| 14 | Leeds | 0.0% | 0.0% | 0.0% | 0.0% | 0.0% | 0.0% | 0.0% | 0.0% | 0.0% | 0.0% | 0.0% | 0.0% | 0.0% | 100.0% | 0.0% | 0.0% | 0.0% | 0.0% | 0.0% | 0.0% | 47.0 |
| 15 | Crystal Palace | 0.0% | 0.0% | 0.0% | 0.0% | 0.0% | 0.0% | 0.0% | 0.0% | 0.0% | 0.0% | 0.0% | 0.0% | 0.0% | 0.0% | 100.0% | 0.0% | 0.0% | 0.0% | 0.0% | 0.0% | 45.0 |
| 16 | Nottingham Forest | 0.0% | 0.0% | 0.0% | 0.0% | 0.0% | 0.0% | 0.0% | 0.0% | 0.0% | 0.0% | 0.0% | 0.0% | 0.0% | 0.0% | 0.0% | 100.0% | 0.0% | 0.0% | 0.0% | 0.0% | 44.0 |
| 17 | Tottenham Hotspur | 0.0% | 0.0% | 0.0% | 0.0% | 0.0% | 0.0% | 0.0% | 0.0% | 0.0% | 0.0% | 0.0% | 0.0% | 0.0% | 0.0% | 0.0% | 0.0% | 100.0% | 0.0% | 0.0% | 0.0% | 41.0 |
| 18 | West Ham | 0.0% | 0.0% | 0.0% | 0.0% | 0.0% | 0.0% | 0.0% | 0.0% | 0.0% | 0.0% | 0.0% | 0.0% | 0.0% | 0.0% | 0.0% | 0.0% | 0.0% | 100.0% | 0.0% | 0.0% | 39.0 |
| 19 | Burnley | 0.0% | 0.0% | 0.0% | 0.0% | 0.0% | 0.0% | 0.0% | 0.0% | 0.0% | 0.0% | 0.0% | 0.0% | 0.0% | 0.0% | 0.0% | 0.0% | 0.0% | 0.0% | 100.0% | 0.0% | 22.0 |
| 20 | Wolverhampton Wanderers | 0.0% | 0.0% | 0.0% | 0.0% | 0.0% | 0.0% | 0.0% | 0.0% | 0.0% | 0.0% | 0.0% | 0.0% | 0.0% | 0.0% | 0.0% | 0.0% | 0.0% | 0.0% | 0.0% | 100.0% | 20.0 |
Position Probability Distribution
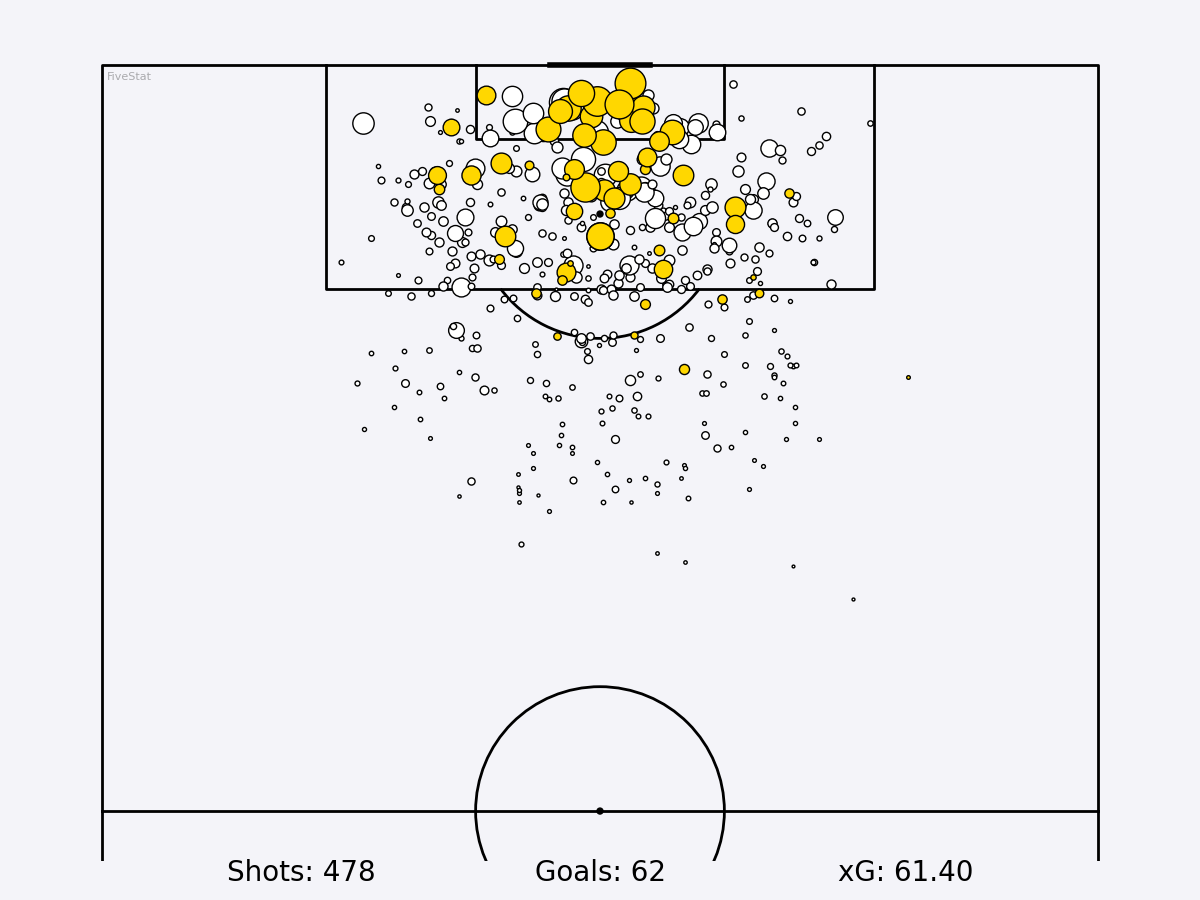
Team Shotmap
We'd love your feedback!
Please take a moment to answer a few quick questions to help improve FiveStat.