Premier League
Fixture Predictions, Table Data and Team Pages for the 2026/27 season.
This tool is free. It's also the same model we'll eventually charge you for, but we're building the audience first.
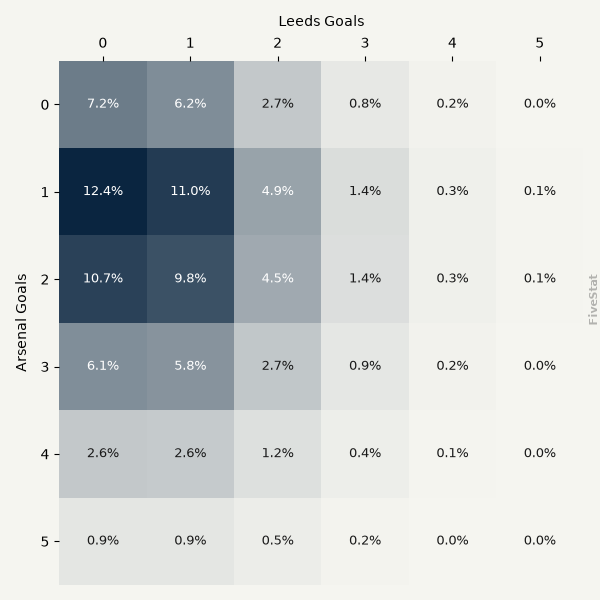
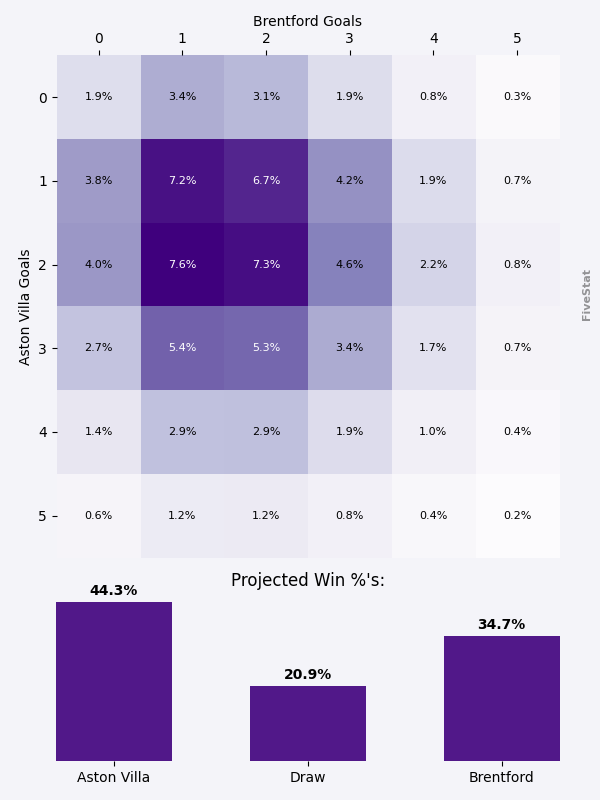
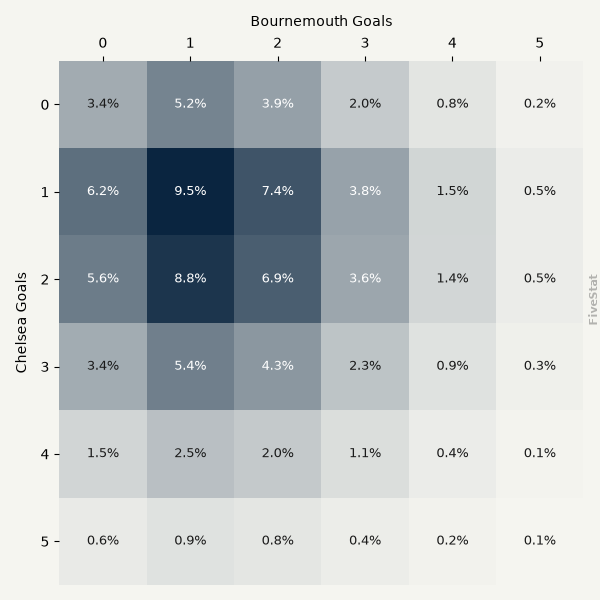
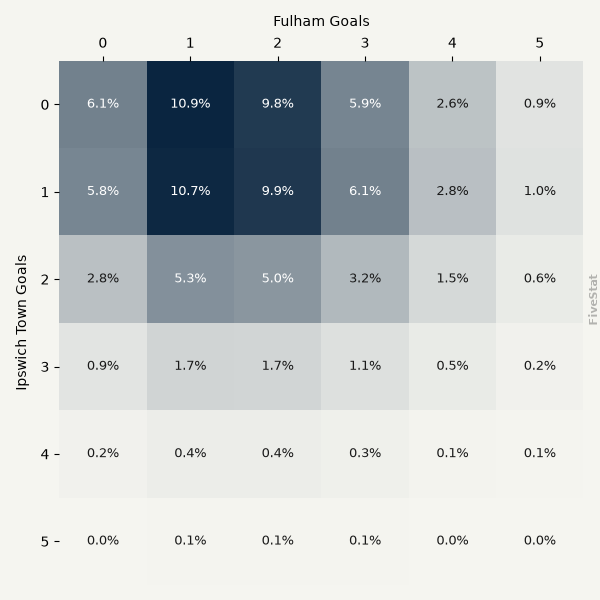
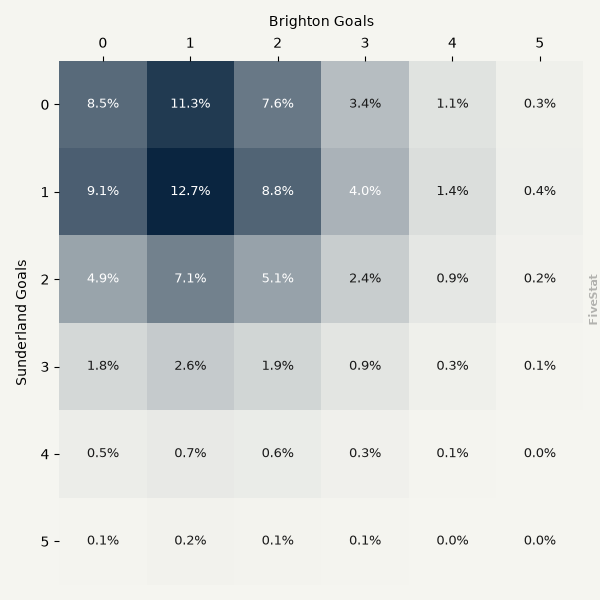
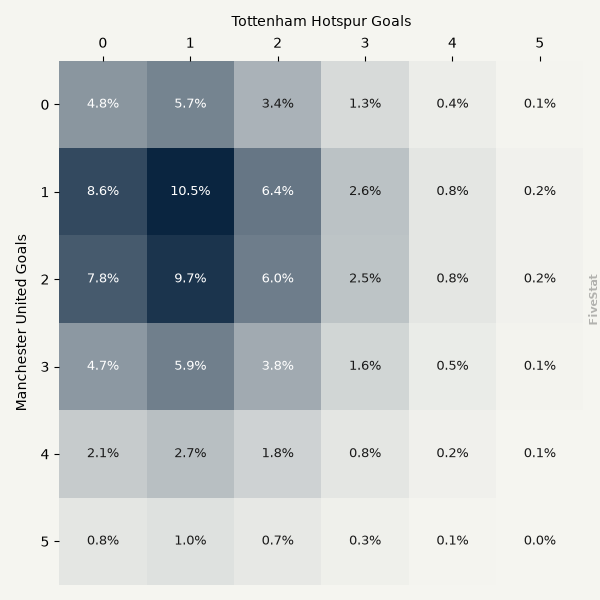
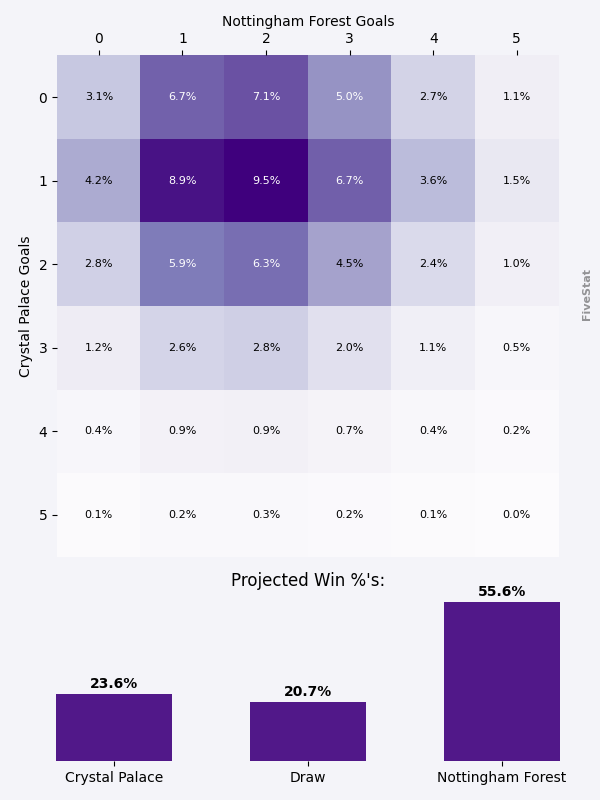
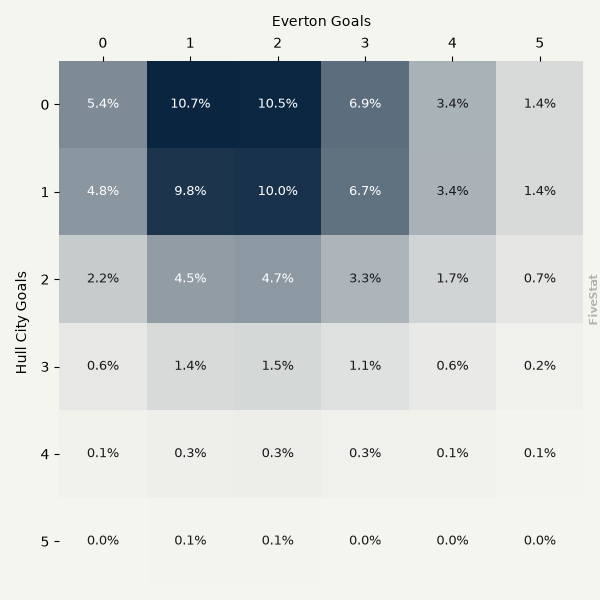
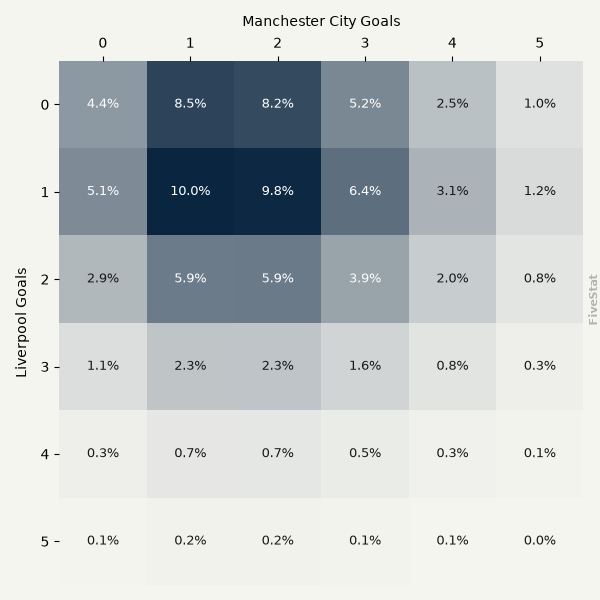
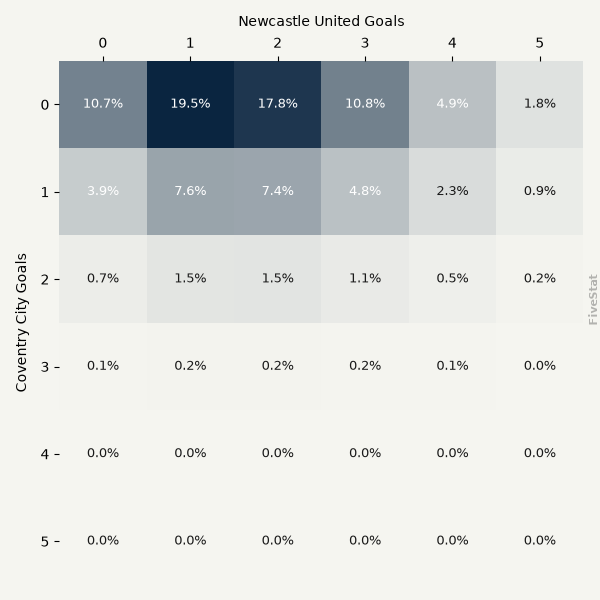
What is the correct score heatmap?
The heatmap shows the probability of every possible scoreline for a given fixture. Each cell represents a home score (rows) vs away score (columns) combination - the darker the cell, the more likely that scoreline is according to the model. The most probable scoreline is highlighted.
How is it generated?
We use each team's attack and defence ratings - built from historical Premier League data and recent form - to estimate the expected goals (xG) for each side. Those xG values are then run through a Bivariate Poisson simulation, which produces a full probability distribution across all scorelines up to 7-7. A Dixon-Coles correction is applied to fine-tune the probabilities of low-scoring results like 0-0 and 1-1, which tend to be slightly underestimated by standard Poisson models.
How should I read it?
The win, draw and away win probabilities shown beneath each fixture are derived directly from the heatmap - summing all cells where the home team wins, all cells where the scores are level, and all cells where the away team wins. The xG figures show how many goals each team is expected to score on average.
A note on correct scores
Football is a low-scoring game with a lot of variance, so even the most probable scoreline in any given match rarely exceeds 15-20% probability. The heatmap is best used to understand the shape of a game - whether it's likely to be a high-scoring affair or a tight, low-scoring contest - rather than as a single-score prediction. You can read more about how the model works on the Methodology page.
Saturday 10 October 2026
12:30
15:00
15:00
15:00
15:00
17:30
Sunday 11 October 2026
14:00
14:00
16:30
Monday 12 October 2026
20:00
Premier League Table
| Rank ▼ | Team | MP | W | D | L | G | GA | GD | PTS |
|---|---|---|---|---|---|---|---|---|---|
| 1 | Manchester City | 5 | 5 | 0 | 0 | 13 | 5 | 8 | 15 |
| 2 | Arsenal | 5 | 4 | 0 | 1 | 8 | 4 | 4 | 12 |
| 3 | Brighton | 5 | 3 | 1 | 1 | 16 | 5 | 11 | 10 |
| 4 | Brentford | 5 | 2 | 3 | 0 | 10 | 4 | 6 | 9 |
| 5 | Leeds | 5 | 2 | 3 | 0 | 7 | 3 | 4 | 9 |
| 6 | Liverpool | 5 | 2 | 3 | 0 | 7 | 4 | 3 | 9 |
| 7 | Everton | 5 | 2 | 3 | 0 | 6 | 3 | 3 | 9 |
| 8 | Hull City | 5 | 2 | 2 | 1 | 6 | 4 | 2 | 8 |
| 9 | Newcastle | 5 | 2 | 2 | 1 | 9 | 9 | 0 | 8 |
| 10 | Chelsea | 5 | 2 | 1 | 2 | 10 | 12 | -2 | 7 |
| 11 | Ipswich Town | 5 | 2 | 0 | 3 | 7 | 11 | -4 | 6 |
| 12 | Manchester United | 5 | 1 | 2 | 2 | 8 | 8 | 0 | 5 |
| 13 | Nottingham Forest | 5 | 1 | 2 | 2 | 4 | 5 | -1 | 5 |
| 14 | Sunderland | 5 | 1 | 1 | 3 | 6 | 10 | -4 | 4 |
| 15 | Crystal Palace | 5 | 1 | 1 | 3 | 6 | 11 | -5 | 4 |
| 16 | Aston Villa | 5 | 1 | 1 | 3 | 4 | 9 | -5 | 4 |
| 17 | Bournemouth | 5 | 0 | 3 | 2 | 6 | 8 | -2 | 3 |
| 18 | Coventry City | 5 | 1 | 0 | 4 | 1 | 10 | -9 | 3 |
| 19 | Fulham | 5 | 0 | 2 | 3 | 5 | 8 | -3 | 2 |
| 20 | Tottenham Hotspur | 5 | 0 | 2 | 3 | 2 | 8 | -6 | 2 |
Season performance
Actual vs Expected
Positive values mean a team has scored more goals than its chances suggested.
Bars show season totals. Teams are ordered by overperformance within the selected view. Hover or tap a team for matches played and per-match figures. Gaps can reflect finishing, goalkeeping, game state or short-term variance and may not be sustainable.
Predicted Final Table
FiveStat ModelWhat is this table?
The Simulated League Positions table shows the probability of each team finishing in every position from 1st to 20th. Each cell is the percentage of simulations in which that team ended the season in that position.
How does the simulation work?
Every remaining fixture is run through our Match Prediction Model, which produces a home win, draw and away win probability for each game. We then randomly sample an outcome for each fixture based on those probabilities, award points, and produce a final league table. We repeat this process 10,000 times.
What does Final xPTS mean?
Final xPTS is each team's current points plus their average simulated points across the remaining fixtures.
How should I read it?
Darker cells = higher probability. A team with a high concentration of dark cells in positions 1-4 is likely to finish in the Champions League spots.
| Rank | Team | 1 | 2 | 3 | 4 | 5 | 6 | 7 | 8 | 9 | 10 | 11 | 12 | 13 | 14 | 15 | 16 | 17 | 18 | 19 | 20 | Final xPTS |
|---|---|---|---|---|---|---|---|---|---|---|---|---|---|---|---|---|---|---|---|---|---|---|
| 1 | Manchester City | 83.2% | 15.0% | 1.4% | 0.3% | 0.0% | 0.0% | 0.0% | 0.0% | 0.0% | 0.0% | 0.0% | 0.0% | 0.0% | 0.0% | 0.0% | 0.0% | 0.0% | 0.0% | 0.0% | 0.0% | 88.0 |
| 2 | Arsenal | 15.4% | 63.7% | 12.3% | 4.9% | 1.9% | 1.0% | 0.5% | 0.2% | 0.1% | 0.0% | 0.0% | 0.0% | 0.0% | 0.0% | 0.0% | 0.0% | 0.0% | 0.0% | 0.0% | 0.0% | 78.3 |
| 3 | Liverpool | 0.4% | 6.0% | 21.1% | 17.5% | 14.4% | 10.9% | 8.2% | 6.7% | 4.9% | 3.6% | 2.4% | 1.7% | 1.1% | 0.6% | 0.3% | 0.1% | 0.1% | 0.0% | 0.0% | 0.0% | 64.4 |
| 4 | Brentford | 0.3% | 5.6% | 19.9% | 16.8% | 14.8% | 11.6% | 8.4% | 7.1% | 4.9% | 3.9% | 2.6% | 1.7% | 0.9% | 0.6% | 0.4% | 0.2% | 0.1% | 0.0% | 0.0% | 0.0% | 63.9 |
| 5 | Brighton | 0.2% | 3.6% | 14.1% | 16.1% | 14.0% | 12.0% | 10.4% | 8.1% | 6.4% | 4.8% | 3.6% | 2.7% | 1.7% | 1.2% | 0.7% | 0.3% | 0.1% | 0.0% | 0.0% | 0.0% | 62.2 |
| 6 | Leeds | 0.2% | 2.2% | 9.2% | 11.7% | 13.0% | 12.4% | 11.6% | 10.2% | 8.1% | 6.3% | 5.4% | 3.5% | 2.5% | 1.9% | 1.1% | 0.6% | 0.2% | 0.0% | 0.0% | 0.0% | 60.5 |
| 7 | Manchester United | 0.1% | 1.8% | 8.6% | 10.1% | 11.0% | 11.8% | 11.0% | 9.8% | 8.9% | 7.5% | 5.7% | 4.8% | 3.6% | 2.4% | 1.5% | 1.0% | 0.4% | 0.0% | 0.0% | 0.0% | 59.3 |
| 8 | Chelsea | 0.1% | 0.8% | 5.4% | 7.4% | 8.8% | 10.1% | 10.8% | 10.7% | 9.5% | 8.8% | 7.8% | 6.2% | 5.0% | 3.7% | 2.5% | 1.7% | 0.7% | 0.0% | 0.0% | 0.0% | 57.7 |
| 9 | Newcastle | 0.0% | 0.7% | 3.8% | 6.5% | 7.6% | 9.1% | 10.2% | 10.3% | 10.3% | 9.4% | 8.3% | 6.8% | 6.1% | 4.6% | 3.0% | 2.0% | 1.1% | 0.0% | 0.0% | 0.0% | 56.7 |
| 10 | Everton | 0.0% | 0.2% | 1.5% | 2.6% | 4.0% | 5.5% | 7.3% | 8.1% | 9.3% | 10.4% | 10.4% | 9.9% | 9.0% | 7.6% | 6.5% | 4.4% | 3.0% | 0.3% | 0.0% | 0.0% | 53.1 |
| 11 | Bournemouth | 0.0% | 0.1% | 1.1% | 1.8% | 3.4% | 4.7% | 6.4% | 7.6% | 8.6% | 9.3% | 10.1% | 10.2% | 9.0% | 9.2% | 7.2% | 6.2% | 4.3% | 0.6% | 0.1% | 0.0% | 51.8 |
| 12 | Aston Villa | 0.0% | 0.1% | 0.9% | 1.9% | 2.8% | 4.1% | 5.5% | 6.3% | 8.1% | 9.2% | 9.6% | 10.6% | 10.2% | 10.0% | 8.1% | 6.9% | 5.0% | 0.5% | 0.1% | 0.0% | 51.4 |
| 13 | Nottingham Forest | 0.0% | 0.0% | 0.3% | 0.8% | 1.5% | 2.2% | 3.1% | 4.4% | 6.2% | 7.0% | 9.0% | 9.8% | 11.3% | 12.2% | 11.9% | 10.2% | 8.8% | 1.4% | 0.1% | 0.0% | 48.6 |
| 14 | Tottenham Hotspur | 0.0% | 0.0% | 0.3% | 0.6% | 1.2% | 1.7% | 2.5% | 3.5% | 5.3% | 6.2% | 7.9% | 9.8% | 10.9% | 11.5% | 12.4% | 13.1% | 10.8% | 2.0% | 0.3% | 0.0% | 47.7 |
| 15 | Sunderland | 0.0% | 0.0% | 0.1% | 0.4% | 0.8% | 1.3% | 1.9% | 3.0% | 4.0% | 5.5% | 6.9% | 8.4% | 10.3% | 11.9% | 13.8% | 14.7% | 14.2% | 2.5% | 0.4% | 0.0% | 46.4 |
| 16 | Crystal Palace | 0.0% | 0.0% | 0.1% | 0.3% | 0.5% | 0.7% | 1.2% | 2.1% | 2.9% | 4.5% | 5.2% | 7.3% | 9.4% | 11.2% | 14.5% | 16.9% | 19.0% | 3.5% | 0.6% | 0.0% | 45.0 |
| 17 | Fulham | 0.0% | 0.0% | 0.1% | 0.2% | 0.4% | 0.7% | 1.0% | 1.9% | 2.5% | 3.5% | 5.0% | 6.8% | 8.8% | 11.0% | 14.8% | 18.1% | 19.9% | 4.4% | 0.9% | 0.0% | 44.2 |
| 18 | Ipswich Town | 0.0% | 0.0% | 0.0% | 0.0% | 0.0% | 0.0% | 0.0% | 0.0% | 0.0% | 0.0% | 0.0% | 0.0% | 0.1% | 0.3% | 0.7% | 2.4% | 7.2% | 45.8% | 37.7% | 5.6% | 28.7 |
| 19 | Hull City | 0.0% | 0.0% | 0.0% | 0.0% | 0.0% | 0.0% | 0.0% | 0.0% | 0.0% | 0.0% | 0.0% | 0.0% | 0.1% | 0.1% | 0.4% | 1.2% | 5.1% | 37.0% | 48.8% | 7.2% | 27.2 |
| 20 | Coventry City | 0.0% | 0.0% | 0.0% | 0.0% | 0.0% | 0.0% | 0.0% | 0.0% | 0.0% | 0.0% | 0.0% | 0.0% | 0.0% | 0.0% | 0.0% | 0.0% | 0.1% | 1.9% | 11.0% | 87.1% | 16.7 |
xTable
What is the xTable?
The xTable ranks teams by their Expected Points (xPTS) rather than actual points. Think of it as a "deserved" league table - stripping out the luck and showing which teams have genuinely been the best and worst performers based on the quality of chances created and conceded.
How is xPTS calculated?
For every match played, we take the model's home win, draw and away win probabilities - based on both teams' xG - and calculate the expected points each team should have earned from that fixture. Summed across the season, this gives each team's total xPTS.
Actual vs expected differences
G − xG shows scoring overperformance, xGA − GA shows defensive overperformance, and PTS − xPTS shows points overperformance. Positive values consistently mean the team is ahead of expectation.
npxG
Non-penalty xG. Strips out penalties to give a cleaner picture of a team's open-play attacking quality.
| Rank ▼ | Team | G | xG | npxG | G − xG | GA | xGA | npxGA | xGA − GA | PTS | xPTS | PTS − xPTS |
|---|---|---|---|---|---|---|---|---|---|---|---|---|
| 1 | Arsenal | 8 | 9.4 | 8.6 | -1.4 | 4 | 5.5 | 4.7 | +1.5 | 12 | 9.8 | +2.2 |
| 2 | Manchester City | 13 | 11.1 | 11.1 | +1.9 | 5 | 7.1 | 7.1 | +2.1 | 15 | 9.6 | +5.4 |
| 3 | Brighton | 16 | 12.9 | 12.1 | +3.1 | 5 | 8.5 | 8.5 | +3.5 | 10 | 9.2 | +0.8 |
| 4 | Nottingham Forest | 4 | 8.5 | 7.7 | -4.5 | 5 | 5.1 | 5.1 | +0.1 | 5 | 9.2 | -4.2 |
| 5 | Brentford | 10 | 10.5 | 9.8 | -0.5 | 4 | 7.5 | 6.7 | +3.5 | 9 | 8.5 | +0.5 |
| 6 | Manchester United | 8 | 10.6 | 9.8 | -2.6 | 8 | 7.2 | 7.2 | -0.8 | 5 | 8.3 | -3.3 |
| 7 | Liverpool | 7 | 8.2 | 7.5 | -1.2 | 4 | 6.9 | 6.1 | +2.9 | 9 | 8.0 | +1.0 |
| 8 | Bournemouth | 6 | 8.0 | 8.0 | -2.0 | 8 | 7.1 | 7.1 | -0.9 | 3 | 7.8 | -4.8 |
| 9 | Everton | 6 | 8.5 | 8.5 | -2.5 | 3 | 7.2 | 7.2 | +4.2 | 9 | 7.7 | +1.3 |
| 10 | Sunderland | 6 | 10.2 | 8.6 | -4.2 | 10 | 8.9 | 8.1 | -1.1 | 4 | 7.6 | -3.6 |
| 11 | Leeds | 7 | 7.2 | 7.2 | -0.2 | 3 | 6.4 | 6.4 | +3.4 | 9 | 7.3 | +1.7 |
| 12 | Chelsea | 10 | 8.9 | 8.9 | +1.1 | 12 | 10.3 | 10.3 | -1.7 | 7 | 6.0 | +1.0 |
| 13 | Ipswich Town | 7 | 7.1 | 7.1 | -0.1 | 11 | 10.3 | 9.5 | -0.7 | 6 | 5.6 | +0.4 |
| 14 | Crystal Palace | 6 | 7.5 | 7.5 | -1.5 | 11 | 10.1 | 10.1 | -0.9 | 4 | 5.5 | -1.5 |
| 15 | Tottenham Hotspur | 2 | 5.8 | 5.8 | -3.8 | 8 | 9.1 | 8.4 | +1.1 | 2 | 5.5 | -3.5 |
| 16 | Hull City | 6 | 5.8 | 5.8 | +0.2 | 4 | 7.2 | 6.4 | +3.2 | 8 | 5.4 | +2.6 |
| 17 | Fulham | 5 | 7.9 | 7.9 | -2.9 | 8 | 10.5 | 10.5 | +2.5 | 2 | 5.0 | -3.0 |
| 18 | Coventry City | 1 | 5.0 | 5.0 | -4.0 | 10 | 8.7 | 7.9 | -1.3 | 3 | 4.6 | -1.6 |
| 19 | Newcastle | 9 | 5.6 | 4.8 | +3.4 | 9 | 9.3 | 8.6 | +0.3 | 8 | 4.3 | +3.7 |
| 20 | Aston Villa | 4 | 5.0 | 5.0 | -1.0 | 9 | 10.8 | 10.8 | +1.8 | 4 | 4.0 | +0.0 |